Linear Dynamics part 3

Objective
Extracting real quantitative data to anticipate everything from earthquakes to rocket launches
In Part 3 of the Desktop Engineering magazine article, we look into extracting real quantitative data to anticipate everything from earthquakes to rocket launches.
Introduction: If you’ve kept up with this series of articles, you now know more about the dynamic behavior of structures than 95 percent of your peer group within the design and engineering world. And after reading about how vibration analysis reveals key information about structural behavior (see DE, April and May 2008), the terms “natural frequencies, normal mode shapes, mass participation factors, and strain energy” have become integral to your vocabulary. Up to this point the discussion has centered on qualitative terms about the mechanical response of structures due to dynamic loading. In this last part, we'll show how to extract real quantitative data (i.e., displacements and stresses) from a simple normal-modes analysis.
Doing It On The Cheap: The dynamic response of a structure is derived from its individual normal modes. If you hit your structure, its dynamic response is formed by the summation of its individual modes. Mathematically, we know that each one of our normal modes
has a frequency, a mode shape, and a bit of mass associated with that shape (a mass participation factor).All of this data is derived from the basic equation of motion: ma+kx = 0 From this equation, the standard linear dynamics solution can be derived as: v = K / m
where vis the frequency or eigenvalue of the system. Since no forces are involved in this equation we can't have any real displacements or stresses. If we want real data, we need real forces as in: (ma+kx = F).
Modal Frequency Sweep (MFS): Frequency-based loads are more common than you might think. Our previous example was of a vibratory conveyor. Since that was rather straightforward, let's look at something a bit more complex.
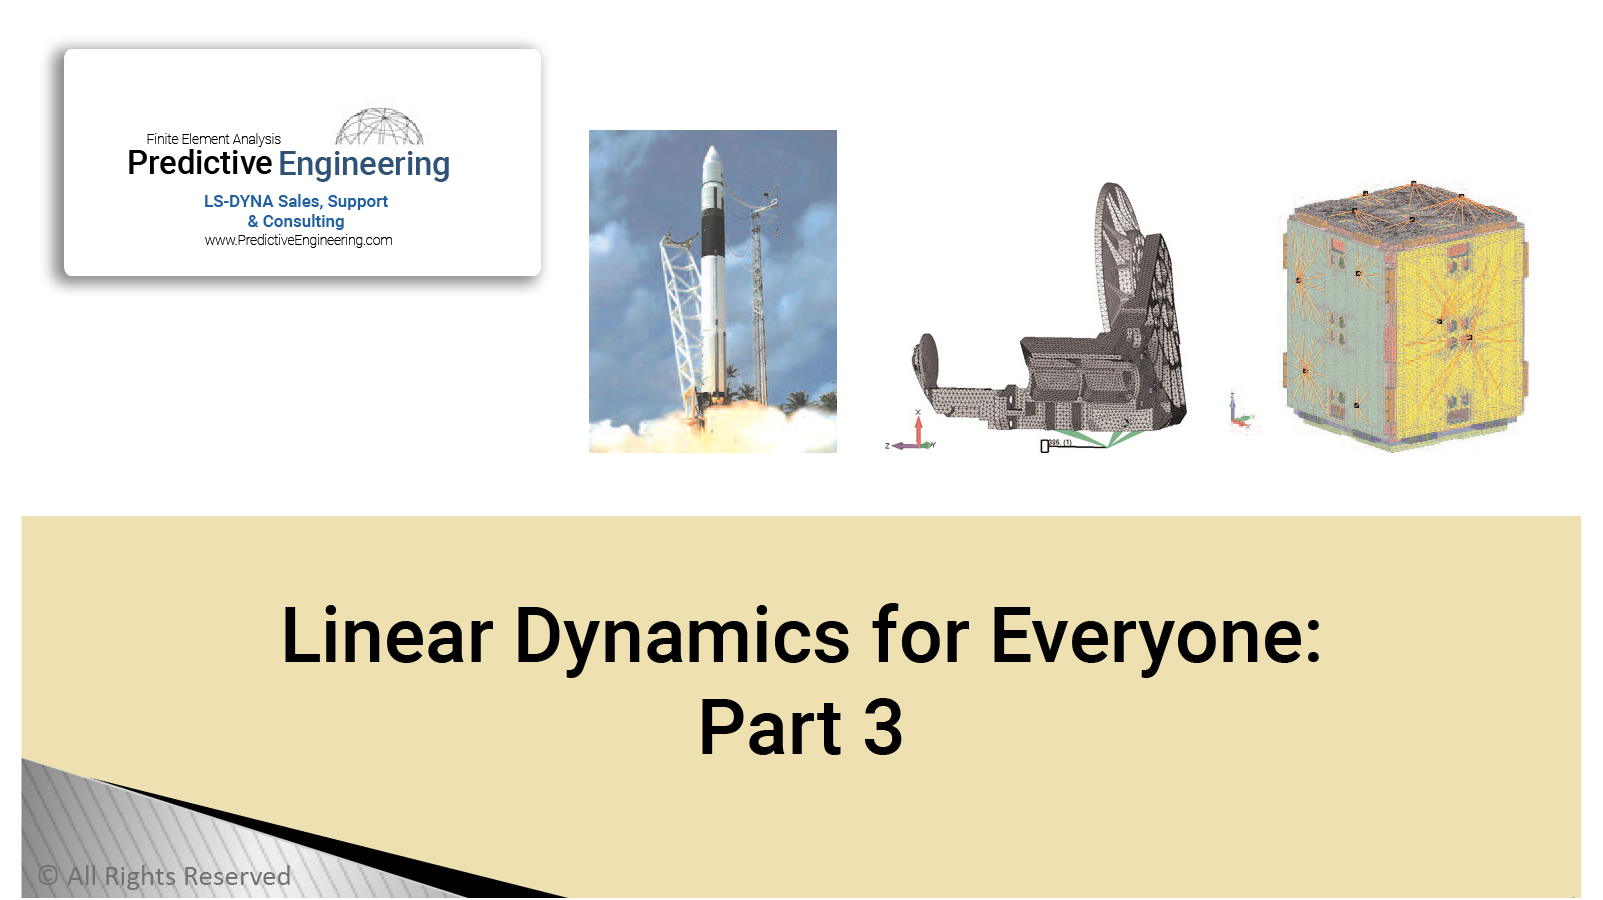
Power Spectral Density (PSD) Analysis: Satellites are expensive and failure is even more expensive. During launch (Figure 3a) they get pounded by a broad and chaotic spectrum of vibrations (accelerations) from the rocket motor, stage separation, acoustical noise, etc. No single acceleration frequency dominates and there are multiple layers of noisy events that occur randomly.
PDF Download

